A new map of both the range and decline of yellow-cedar has been published in Global Change Biology with help from researchers in Alaska, BC, and Washington. The high resolution range map stretches from northern California to southcentral Alaska, from sea level in the north to treeline in the south. The decline, now quantified at ~400,000 ha (about 7-8% of the total range area), covers southeast Alaska and central coastal BC, down to about 50 degrees north. It is primarily located in areas where the mean winter temperature is between -2 and +2 degrees C, as anticipated. The future climate of the region is expected to warm to that threshold by 2070 in most locations. However, there are a few places above that threshold where cedar is apparently healthy, probably due to a lack of cold winters to trigger the decline when there is no snow on the ground like the outside of Vancouver Island. How representative these sites are of the population at large needs to be further quantified. Next steps include a predictive model of decline and comparison of the decline maps to other sources of mortality data.
Buma B, Hennon PE, Harrington CA, Popkin JR, Krapek J, Lamb M, Oakes LE, Saunders SC, Zeglen S. Emerging broad-scale mortality driven by climate warming and loss of snowpack. Global Change Biology. In press.
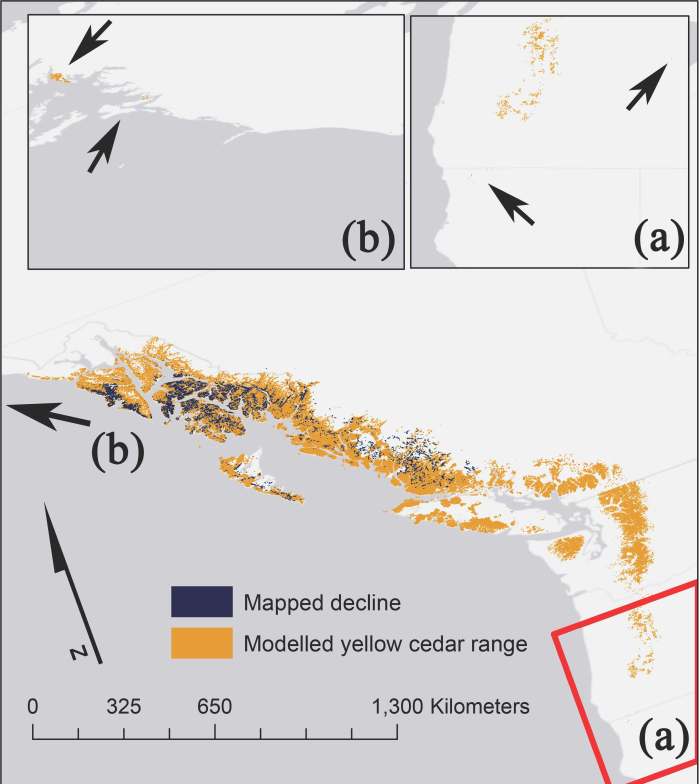
New range layer of yellow-cedar and observed mortality. Insets show detail at extreme range edge. A: Northern California and southern/eastern Oregon (red box). B: Prince William Sound and Icy Bay. Inset arrows show small, disjunct populations.
